You are here

Graphs

Fishman Island Data Set

Submitted by crmckenzie on Fri, 03/23/2018 - 15:09

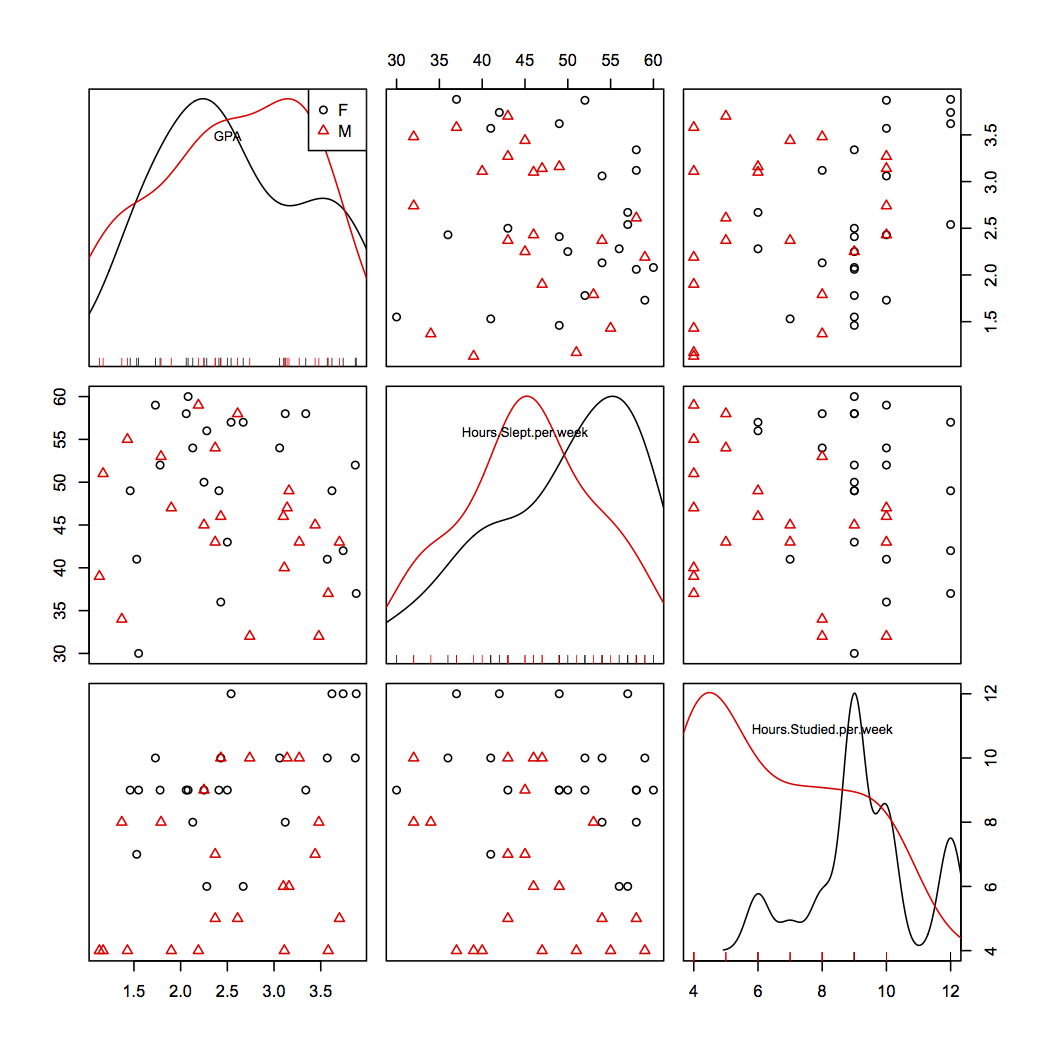
Figure 1. Fishman Island Data Set. The above scatter plots show a positive correlation between hours slept and GPA, as well as between the number of hours spent studying and GPA. We removed outliers that skewed the data set, including indivduals that slept less than 35 hours a week, an individual who studied for 50 hours and an individual who identified as "other" when asked to identify as a gender. The strongest correlation seen was between the hours studied per week and the corresponding GPA. Amongst genders there was not an observeable difference, when looking at GPA,s.

Baltigo RPlot

Submitted by jonathanrubi on Fri, 03/23/2018 - 15:01

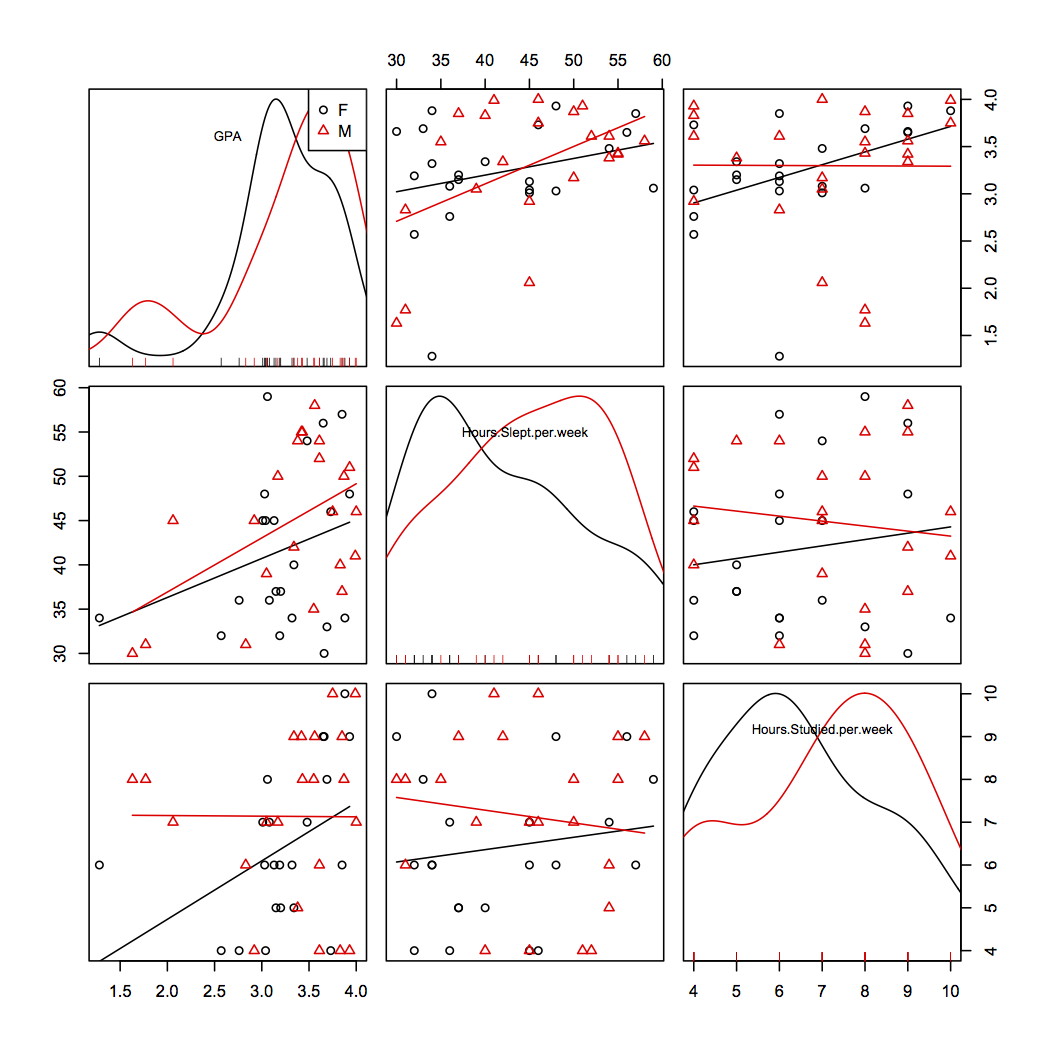
Relationship between GPA, Hours Studied, and Hours Slept per week on Baltigo Island plotted by Gender. A negative correlation was shown between GPA and hours studied for females. However, a positive correlation is shown between GPA and hours studied for males. Also of note, a negative correlation is seen between the hours studied and hours slept for females, and a positive correlation is seen in males. A data entry was removed that input a gender of "O". 

- Jonathan Rubin, Liam Harvey, Malaika Komtangi

Ohara Data Graphs

Submitted by mglater on Fri, 03/23/2018 - 14:52

Fig 1. Grade Point Average in Relation to Hours Slept and Hours Slept. In both the males and females studied, GPA has a positive correlation to number of hours studied. Females showed positive correlation between hours slept and hours studied. Males had little correlation between sleep and study hours. In females, there is a negative trend between higher hours of sleep and GPA. Males had little correlation between sleep and GPA. One outlier removed from data due to unknown gender designation.

Moss Glater, Sage Workman, Brett Connolly

Baltigo (Alberigi, Mirley, Oringham)

Submitted by malberigi on Fri, 03/23/2018 - 14:44

FIgure 1: Gender, GPA, hours slept, and hours studied were measured on the island of Baltigo. Outliers removed include one participant where gender was specified as “other”, one where hours of sleep per week was 94, one one where hours of sleep per week was 11, one where hours of studying per week was 23, and one where GPA was recorded as 5.43.

Group 7 Kurakari Graph (Jennifer Gomez, Christine Fellrath, Nova Chenda)

Submitted by cfellrath on Fri, 03/23/2018 - 14:39

These graphical representations illustrate the data set correlating with Kurakari without outliers. It is presented in a scatterplot manner. Outliers were removed. For instance, in the hours studied per week had a value of 60 and a GPA of 1.08. This was not within the range of the other values.

Marineford Group 2 (lgiron, mrmoy)

Submitted by lgiron on Fri, 03/23/2018 - 14:35

Figure 1. Marineford. Graphs of the difference of GPA, hours slept per week, and hours studied per week based on gender. Two outliers have been removed to normalize the data set. Based on the data, females on average slept more hours than males and had a higher average GPA. The data between hours slept and GPA showed a positive correlation in males meaning that when males got more hours of sleep, there gpa went up. This is also true about the female data, but it is not as significant. Based on the data, females on average studied more hours than males.

Subscribe to RSS - Graphs