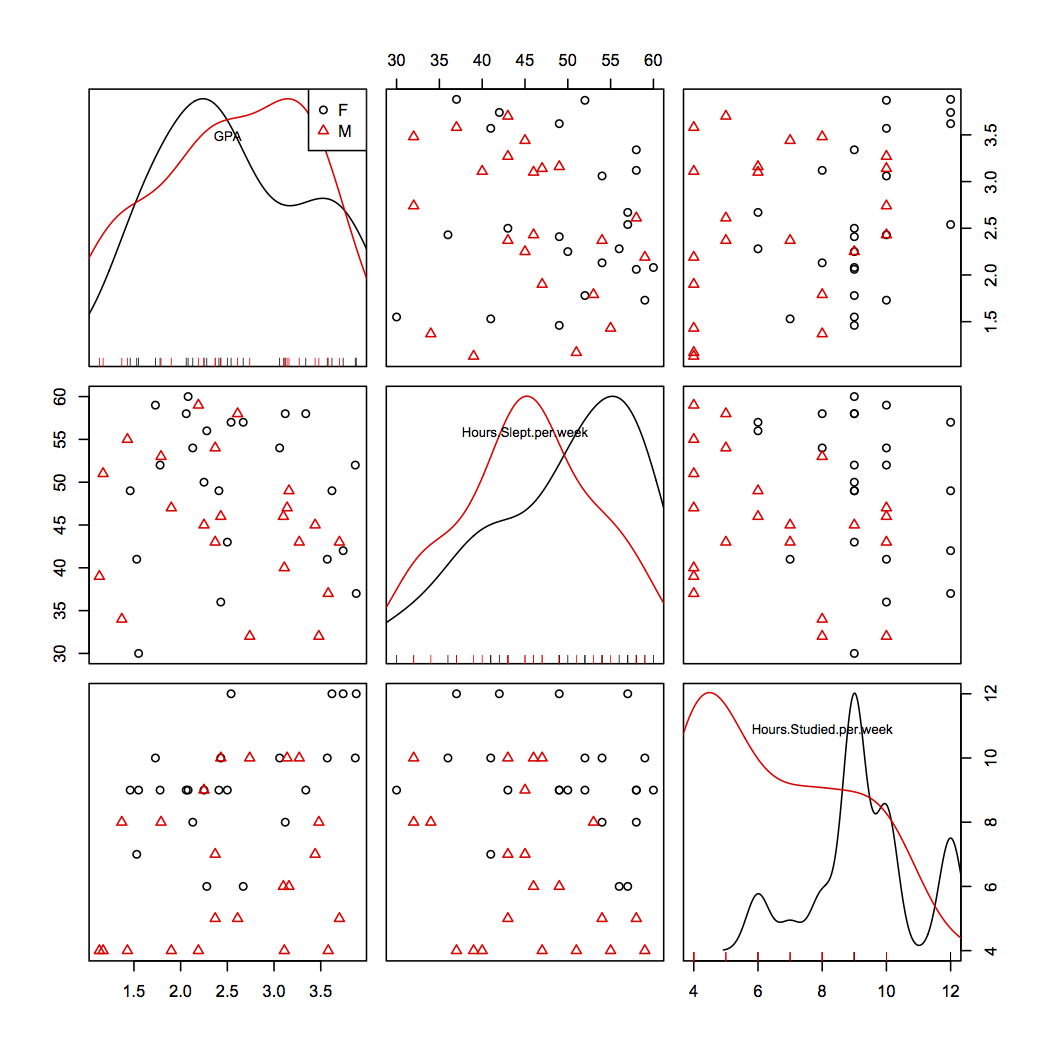
These graphical representations illustrate the data set correlating with Kurakari without outliers. It is presented in a scatterplot manner. Outliers were removed. For instance, in the hours studied per week had a value of 60 and a GPA of 1.08. This was not within the range of the other values.
Recent comments