Welcome to Writing in Biology
We will use this site to post blog entries, perfect paragraphs, images, and references. You will need to activate your Biology Department account to use the site.
We will use this site to post blog entries, perfect paragraphs, images, and references. You will need to activate your Biology Department account to use the site.
A research project was conducted on several different islands resulting in the data below:
Alabasta
Baltigo
Enies_Lobby
Fishman_Island
Karakuri
Marineford
Momoiro_Island
Ohara
Sabaody_Archipelago
Skypiea
• Install R and Rcmdr. Refer to R Commander Installation Notes for details: http://socserv.socsci.mcmaster.ca/jfox/Misc/Rcmdr/installation-notes.html
• Import the data:
  ◦ In Rcmdr. under “Data” menu “Import data” from “text file”
  ◦ Set the “Field Separator” to “Commas”.
  ◦ Navigate to the CSV file and select it.
• Click the “Edit data set” button to open the data set in a window..
  ◦ Make a note of all outliers (to put in the legend of the figure).
  ◦ Click on the number of each row with an outlier, then right-click and “Delete current row”.
  ◦ Click OK to save edited data set.
• Under “Graphs” choose “Scatterplot matrix...”
  ◦ Select all three variables.
  ◦ Click “Plot by groups”, select Gender, and click OK.
  ◦ Click “Options” and select the checkbox for Least-squares line and click OK.

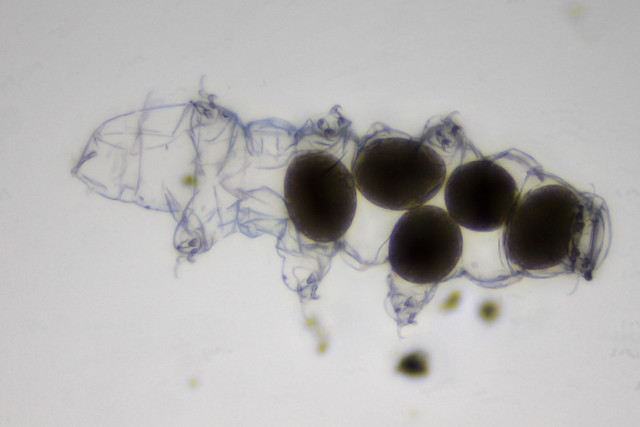
Figure 1. Tardigrade with eggs. Focus stacked image of non-living tardigrade. Creative commons licensed image by Specious Reasons https://flic.kr/p/ZHFAdR
Screencasts for making multipanel scientific figures using Inkscape
Creating Figures: Part 1. Compositing
Creating Figures: Part 2. Labels and Arrows
Creating Figures: Part 3. Document Properties and Exporting
Hints
Workflow
Note: Do not share your finished figure or include in your METHODS manuscript until your methods have been followed!
Work in pairs. Each pair should follow a link, briefly discuss, and be prepared to report on the reliability, validity, and trustworthiness of the site. How do you assess these characteristics?
Recent comments