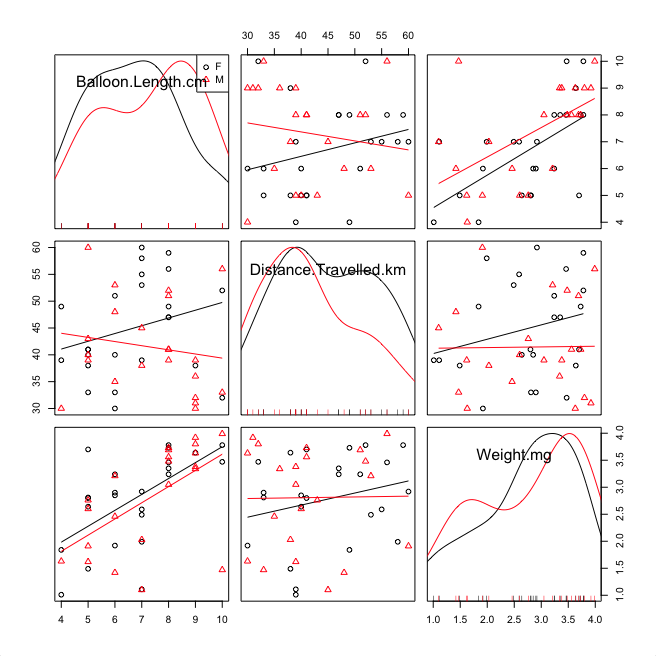
All the balloon length measurements are between 4 and 10 cm, but there is one value that is 50 cm, making it an outlier.
For the top right graph which displays balloon length versus weight, males have a greater value than females consistently throughout, but they both follow the same positive correlation pattern of consistently increasing in weight as they increase in length. In contrast, the graph all the way to the right of the middle row displays distance travelled versus weight, and the males have no correlation at all while the females have a positive correlation. The graph all the way to the left of the middle row shows balloon length versus distance travelled, and males have a negative correlation while females have a positive correlation.
Recent comments