You are here

sbrownstein's blog

Flower Figure Observations

Submitted by sbrownstein on Fri, 09/28/2018 - 14:58

Page 30:

Observations:

-Yellow 

-Pedals pointing downward

-Small, brown pistil projecting upward (about 1 cm in width)

-Present in bunches

-Low to the ground

-Relatively small flower

-Lighting is brighter on the two outside pictures

-Saturation on the top figure, on the left images


Inferences:

-Pedals point downward in order to reach more sunlight for photosynthesis

-Grow in bunches to provide protection or nutrients to each other

-Grows low to the ground to require less maintenance and receive more shade during the day


The figure that was observed contained four pictures of a species of yellow flower. Three of the four images were individual pictures of a flower and the last picture was a bunch of the yellow flowers that were growing close to the ground. The yellow flowers had a brown pistil that projected upward, followed by the bright yellow pedals that pointed downward. I believe that this orientation was to make it easier for the flower to receive sunlight to perform photosynthesis. This species of flower was pictured growing in bunches, close to the ground. I believe that the clustered growth was beneficial to the flower in order to provide protection and nutrients to one another. The low growth could be advantageous because it allows the flower to require less maintenance and receive shade during the day.

            The lighting on the left picture seems to be brighter than the other pictures in the figure. It does not look like any filters were used to enhance the pictures. A ruler was used in the picture in the middle left in order to show a scale as to how large the yellow flowers typically are. They are relatively small of about a couple inches. All if the pictures in the figure were taken at different angles, such as straight on or from the side.
Incomplete Methods Perfect Paragraph

Submitted by sbrownstein on Thu, 09/27/2018 - 13:14

Before starting the exploration for a spider web, I brainstormed some locations that spiders may be present on campus. Initially, I thought to look in the old academic buildings on campus, such as Bartlett, Herter, or the Morrill Science Buildings. It was easiest for me to search in the Morrill Science Buildings first due to my class schedule, specifically Morrill II. When looking for a spider web in Morrill II, I knew to look in areas that were undisturbed. This was because undisturbed areas, such as corners and closets, would give a spider the opportunity to build a web without any complications. I slowly examined each hallway, looking in corners and stairwells. Finally, on the third floor, in the hallway connecting the Morrill II building and the Morrill III building, I came across a concaved rectangle in the wall. The groove in the wall looked untouched for a decent amount of time. I approached the bottom left corner of the groove and found a small spider sitting in the middle of a faint web. I took several pictures of the spider and its web with the flash on. Some pictures were facing down toward the web and some were taken against the left wall to display the definition of the web. The flash seemed to scare the spider further back into the corner, therefore I tried not to take excess pictures. In addition, I took a picture of the hallway the wall indentation was located to orient my reader as to where I found the spider web.


Incomplete Methods - Draft 3

Submitted by sbrownstein on Thu, 09/27/2018 - 13:14

I needed labels on each of my pictures to enable me to easily identify them when referencing my figure. I used the text feature on Inkscape and typed the letter “A” off to the side of the figure. The letter would be hard to see on top of my pictures, therefore I used the rectangle and square feature to create a box around the letter. I edited the box to obtain a white background allowing the black font letter to be easily visible. I selected the letter “A”, raised it to the top of the box and centered the letter using the alignment settings on Inkscape. To move the letter in the box as a full unit, I selected both and grouped them. This label is now completed, yet I needed four additional labels for the rest of my pictures. I selected the “A” label and duplicated it four times. The text feature was used to edit the duplicates to display letters “B-E”. The labels were then positioned in the top left corner of each picture. Lastly, I believed an arrow pointing to the corner of the groove in the wall that the spider was found would be necessary to the readers understanding of the location. The straight line feature was used to make a diagonal line that was around one inch in length. I thickened the line and added an arrow marker to the end. The arrow was positioned pointing down, from the top right side, to the bottom left corner in the hallway that the spider was found.

           My figure was finished and ready to be saved and exported. First, I selected document properties to resize page to content. This allowed my image to be the same size as a piece of paper. I set the background color to be white by selecting the bottom “A” column and moving the curser to the right. This ensured that my figure was not transparent. I saved my figure with the title of my username, followed by “-original.svg”. Lastly, I exported my figure as a PNG and set my image width to 1200 pixels. My multi-panel figure of my spider web and its location was complete and exported.


Incomplete Methods - Draft 2

Submitted by sbrownstein on Wed, 09/26/2018 - 10:15

After collecting the pictures of the web and its location, I was required to find a picture of a map that would show my reader where my spider web was found on campus. My first instinct was to use the map on the “My UMass” App. This App has a feature to navigate campus via a map system. By searching for the building I found the spider in, Morrill II, I was able to screenshot it’s exact location. I kept both the Morrill II and the Morrill III buildings in the map to show that the hallway the spider was found in was connected both buildings. As a result of collecting all of the pictures needed to create my multi-panel figure, I downloaded the program Inkscape. This program required that I also downloaded the program XQuartz. I uploaded all of my pictures onto the Inkscape canvas and began to experiment with some possible orientations. I decided that having my location pictures on the left side and the spider web pictures on the right side would be the most asthetically pleasing. First, I selected the hallway and map picture and set them both to equal width measuements of 106.6 mm. This was to create a straight midline within the figure. The hallway picture was placed on top of the map picture on the left side. The heights of the two pictures were slightly different because I wanted the map picture to be emphasized, therefore setting the height to be around 10 mm taller. The midline was offset to the right by about 3 mm in order to emphasize the location pictures. I stacked the three spider web pictures on top of each other on the right side, aligning all of their widths to be around 103.7 mm. The heights of the three pictures varied in increasing order down the figure. I belived this format was the most logical and easy to comprehend.


Incomplete Methods - Draft 1

Submitted by sbrownstein on Tue, 09/25/2018 - 14:11

Before starting my hunt for a spiderweb, I had brainstormed some locations that spiders may be present on campus. My first thought was to look in the older academic buildings on campus, such as Bartlett, Herter, or any of the Morrill Science Buildings. It was easiest for me to check the Morrill Science Buildings first due to the fact that I have  many classes in that area of campus. I have many classes in Morrill II, so I had investigated there first. As I was looking for a spider web in Morrill II, I knew to look for areas that were undisturbed. This was because undisturbed areas, such as corners and closets, would give a spider the opportunity to build a web without any confrontation. I slowly walked through each hallway on every floor, looking in corners and stairwells. Finally on the third floor in the hallway connecting the Morrill II building and the Morrill III building, I came across a encaved rectangle in the wall. There was nothing placed in this groove in the wall and had looked untouched for a decent amount of time. I approached the bottom left corner of the groove and found a small spider sitting in the middle of a faint web. I took several pictures of the spider and its web with the flash on. Some pictures were facing down toward the web and a couple others were taken against the left wall in order to view the definition of the web. The flash seemed to scare the spider further back into the corner so I tried not to take more pictures than I needed. In addition, I took a picture of the hallway the indentation the in the wall was located in order to orient my reader as to where I found the spiderweb.


Polyprotic Acids Chem Lab Report - Draft

Submitted by sbrownstein on Mon, 09/24/2018 - 17:49

The results of both reactions were not expected. Originally, there were supposed to be three jumps in pH change in both reactions with different acids. Yet, in the citric acid reaction, only the third jump in pH was visible on the graph because the first two jumps were so miniscule. On the graph of the phosphoric acid reaction, only the first two jumps in pH change were visible because the last jump in pH change was too diminutive to observe. The hydronium concentration that was calculated for the citric acid reaction was 4.027 x 10^-9 M. This concentration was similar to the hydronium concentration given in the procedure: 4.0 x 10^-7 M. The hydronium concentration was found by using the pH halfway through the jump in pH change and using logarithms to isolate the concentration. The calculated hydronium concentration in the first jump in pH change of the phosphoric acid reaction was 2.137x 10^-5 M. This calculation was not as accurate as the citric acid calculations. The given hydronium concentration of the first jump in pH change was 7.5 x 10^-3 M. This variation may be because of human error when adding the NaOH to the acid or the time gaps when recording the changes in pH. The second calculated hydronium concentration for the second jump in pH change was 1.135 x 10^-9 M. This calculation was also not accurate. The given hydronium concentration for the second jump in pH change was 6.2 x 10^-8 M. This variation could possibly be from the same errors made on the first calculation of hydronium concentration in the first jump in pH change of the phosphoric acid reaction.


Figure legend Practice

Submitted by sbrownstein on Fri, 09/21/2018 - 14:16

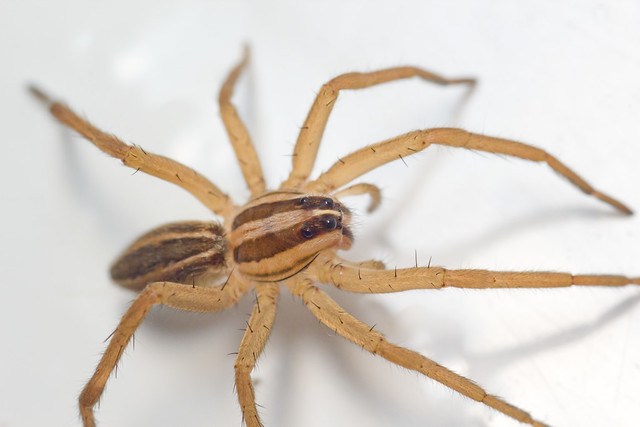
Zoridae Spider

Figure 1. This spider displays the long hairy legs that the Zoridae spider family obtains. This trait is adventageous to their location on webs and other terrain. The legs have many hair follicles to imprive their sense of awareness. The spider's legs extend about an inch out from its abdomen. The legs bend at multiple joints and are a consitent color throughout all eight legs.

"Who Is In My Tub? 2" flickr photo by Monkey Mash Button https://flickr.com/photos/monkeymashbutton/6891355566 shared under a Creative Commons (BY-SA) license

Biodiversity Lab - Perfect Paragraph

Submitted by sbrownstein on Thu, 09/20/2018 - 12:53

In this lab, the diversity of plant species in different environments were observed. The diversity of plant species were collected on a hill and a flatland. Depending on the slope of the environment, the plant diversity differed. Diversity is beneficial in an environment due to the stability it creates, making organisms more suitable for fighting disease and responding to other changes to its surroundings. An environment is healthy when it is very rich. Richness is the number of species in a community. The most common way to determine whether an environment is diverse is by calculating the Shannon Diversity Index. The Shannon Diversity Index is a method to mathematically measure a community’s diversity (Beals). This is important to biologists, enabling them to observe how rare or common a species is in an environment (Beals). Different enviornments were observed in order to see if the type of topography resulted in a difference in plant diversity. On a hill, the nutrients and soil ran down to the bottom, preventing plants from using them. The assumption can be made that there will be less diversity on a hill than there would be on a flatland due to the lack of nutrients.

Chemistry Acid Concentration Lab - Draft

Submitted by sbrownstein on Thu, 09/20/2018 - 12:08

The hydronium concentrations was found by using the pH halfway through the jump in pH change and using logarithms to isolate the concentration. The hydronium concentration that was calculated for the Sprite and NaOH reaction was 8.91E-9 M. This concentration was correlated, yet not similar to the citric acid concentration found in the previous experiment: 4.027E-9 M. This could be due to human error, such as adding too much base when trying to control the pH measurements. The calculated hydronium concentration in Coke and NaOH reaction was 1.02E-8 M. This concentration was similar to the phosphoric acid concentration found in the previous experiment: 1.07E-5 M. The hydronium concentrations that were calculated equal the Ka of half of the reaction. This is why we were able to solve for the hydronium concentrations by looking at the jumps in pH change as the volume of base increased.


Biodiversity Lab Cont #2 - Draft

Submitted by sbrownstein on Wed, 09/19/2018 - 10:31

Based on the results collected by our group the next step in our experiment would be to identify the type of plant that was predominantly found on the hilly area and examining other hilly areas to find if the same type of plant dominates those places, as well to add to the concept that the plants found on the hilly area are more fit for survival on a hill than other plants. In this case, the hypothesis would be “Hilly areas will be dominated by species more fit for survival on a slope compared to flat areas that provide nutrients for more diversity.” By doing this, we would be able to further support our hypothesis of hilly areas being lower in diversity, and determine if the new hypothesis is correct. However, for this experiment, different climate factors would have to be taken into consideration since certain plants cannot grow in certain temperatures. To ensure that the results would be as precise as possible, doing the data collection at the same time of the year (springtime) as the data already collected in this experiment would be crucial. Though the results would still vary because of amounts of sunlight. precipitation, etc., there would be a greater chance that the data would be closer to the data that was found in the hilly area.


Pages

Subscribe to RSS - sbrownstein's blog